
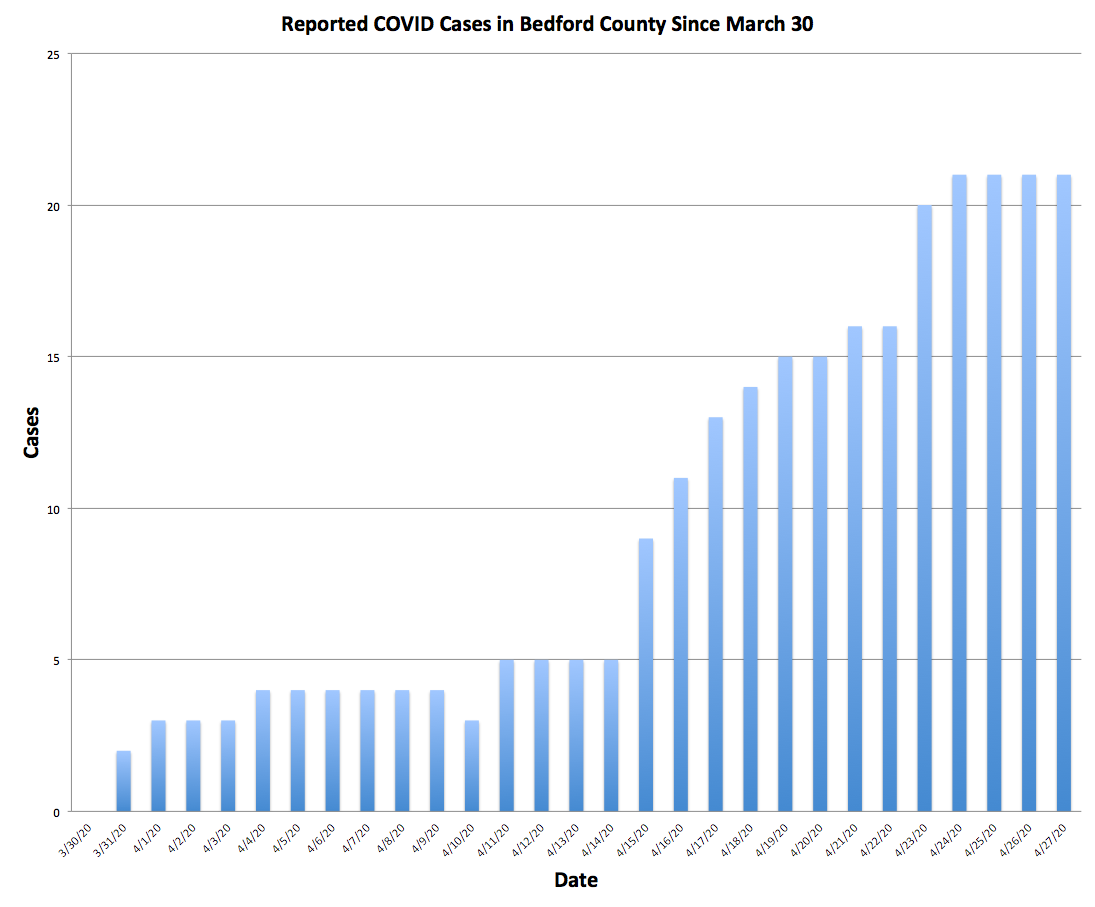
Bedford County COVID cases are starting to increase at a regular rate.
Graph of Number of Reported Bedford County Cases by Day
This graph shows the number of Bedford County COVID cases since the last day we did not have a case. The first case was reported March 31. You can click the graph to view an enlarged version in a new window or tab.
How Does Bedford County Compare with Neighboring Counties?
This graph shows how the number of Bedford County cases compares to neighboring counties. Each cluster of bars represents cases for the same day. You can click the graph to view an enlarged version in a new window or tab.
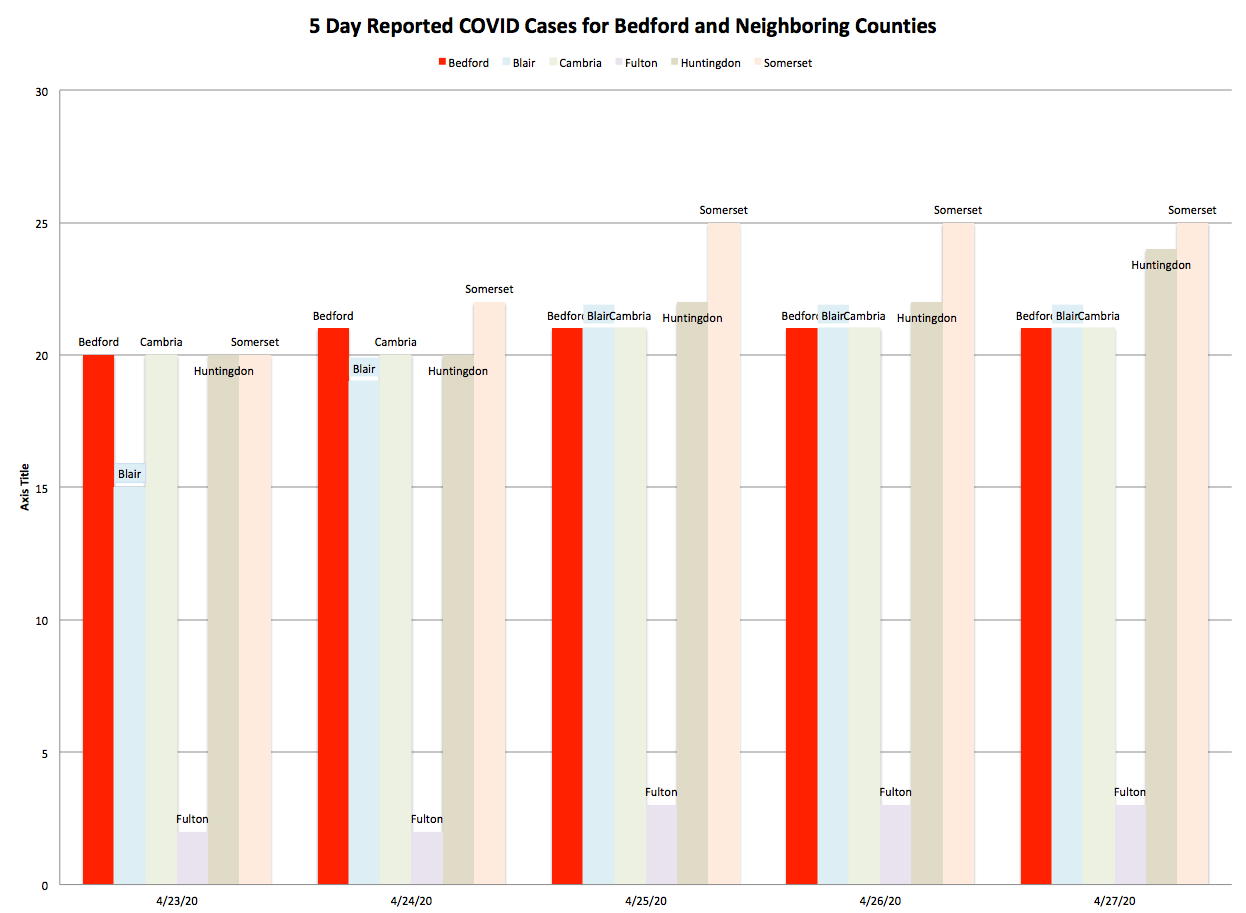
Cases per 10,000 People in the County
We might think the less populated counties would have fewer cases. Among Bedford and its five neighboring counties, Bedford and Huntingdon have the smallest populations, but they have the highest number of cases per 10,000 people.

PA Department of Health Interactive Map Showing Cases per County and Cases per Zip Code
Use this map to follow the number of cases by zip code. The map opens in county view. Click on the county to see the number of cases within a county, or switch views to see the number of cases by zip code. Use the tabs at the bottom to switch between county data and zip code data views. (Map will open in a new window or tab.)
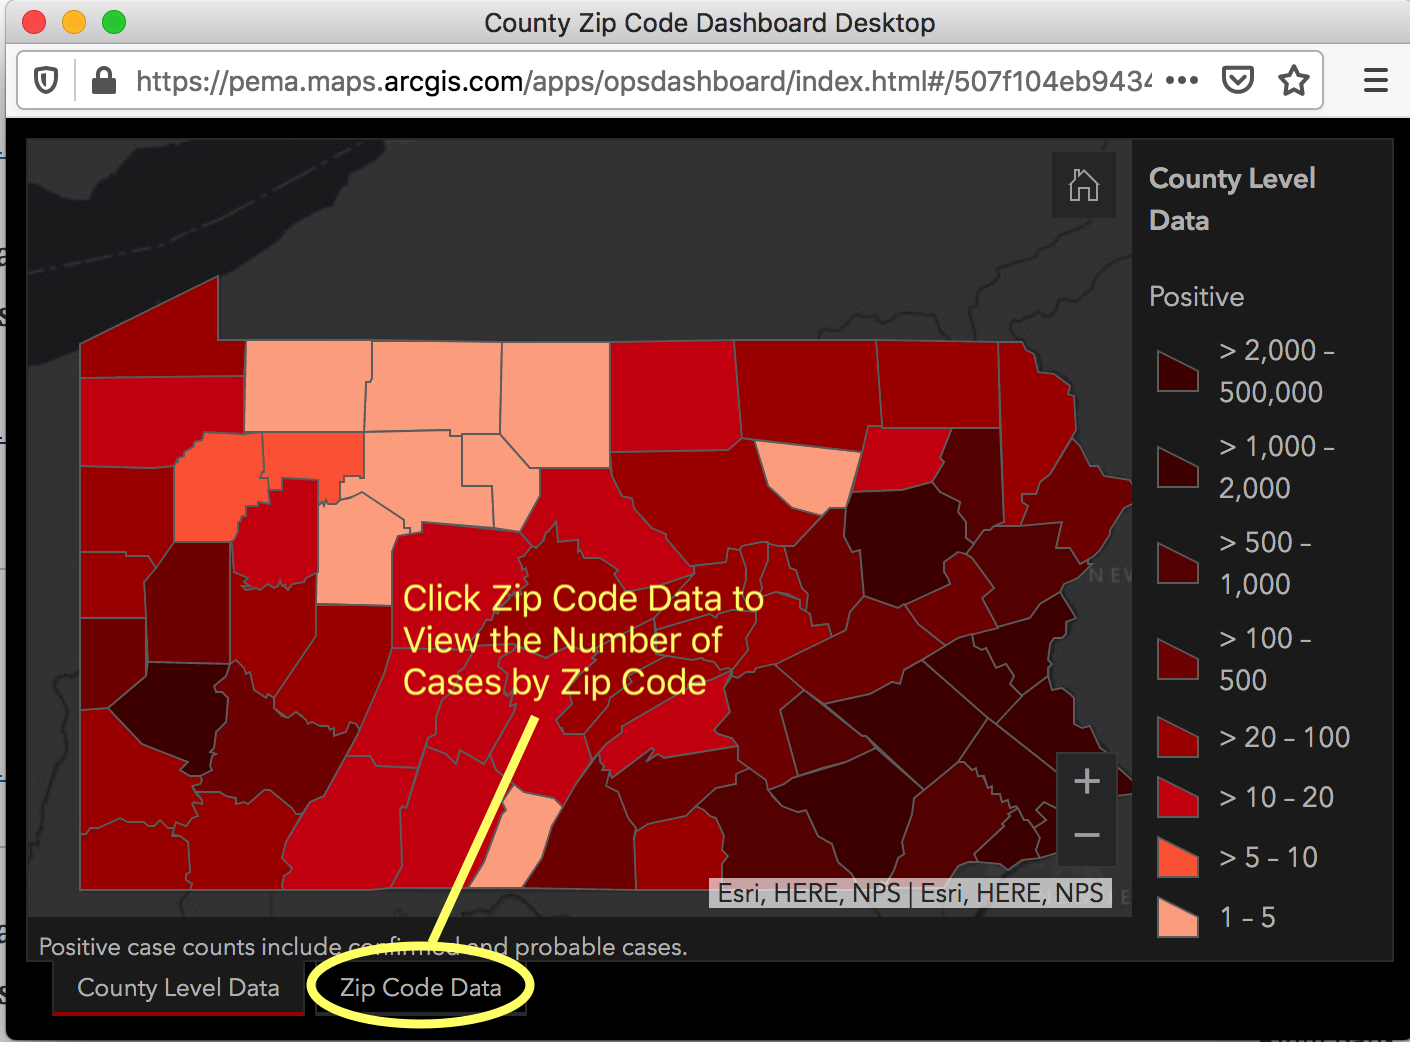
Click this link or the image to view the PA Department of Health county level data.
